-2.png?height=120&name=Ozen%20Long%20-%20Back%20(1)-2.png)
- Help Center
- Ansys CFD
- Fluent
-
Getting Started With Ansys
-
Ansys Installation
-
Licensing
-
Ansys Mechanical
-
ANSYS AEDT
-
Ansys Maxwell
-
Ansys HFSS
-
Ansys CFD
-
CAD
-
Meshing
-
LS-Dyna & LS-Prepost
-
SpaceClaim
-
Ensight
-
Ansys Lumerical
-
Zemax
-
Discovery
-
AUTODYN
-
Workbench
-
Ansys EMC Plus
-
SIwave
-
CFD-Post
-
Ansys Sherlock
-
Q3D
-
Ansys 3D Layout
-
Fluent Meshing
-
Thermal Desktop
-
Icepak
-
Ansys Icepak
-
Twin Builder
-
Fluent
-
AEDT Circuit
-
EMA3D
-
Linux
-
Optislang
-
Motor-CAD
-
Ansys CFX
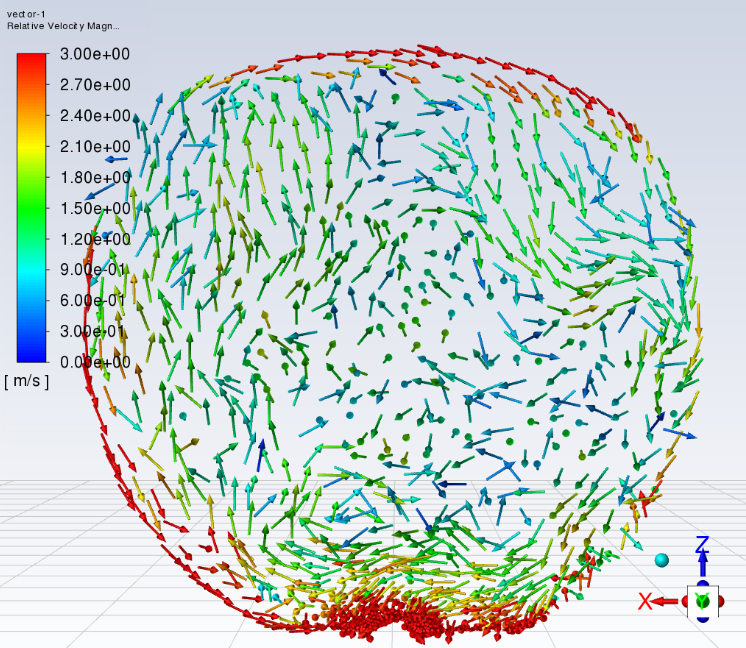
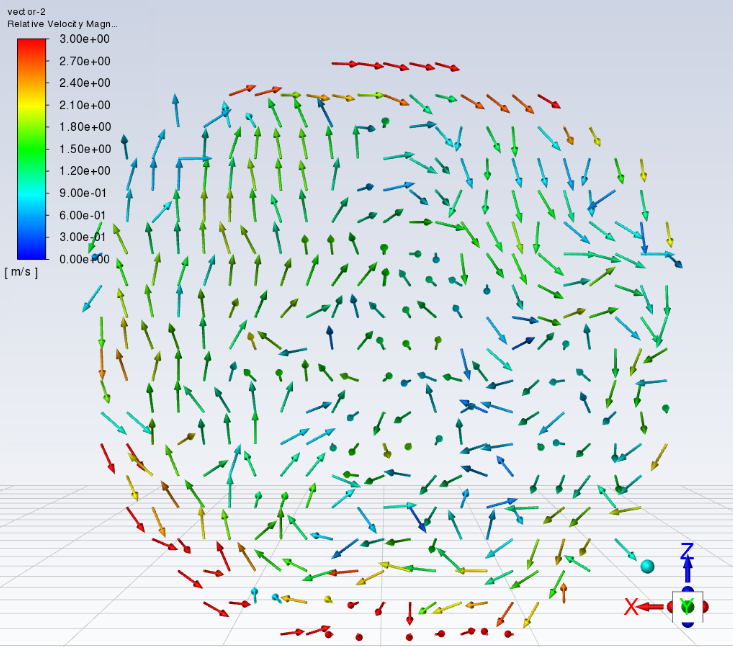
Uniformly Spaced Vector Plots in Fluent
In order to get uniformly spaced vector plots using Fluent post-processing please follow the steps below:
1. Obtain the min/max limits in x,y,z coordinates on the plane you want to present the vectors. First create your plane, then using contours plots display and record the minimum and maximum values in x, y, and z directions.
2. Use the following TUI command to create the point array:
/surface/point-array surfacename numberofdivisions xmin ymin zmin xmax ymax zmax
here is an example below:
/surface/point-array postsrf 30 0.08636 -0.1196 0.0038 0.08636 0.3302 0.1689
3. Select the surface you created in Step 2 in the vector plot.
You can see the difference in clarity in the two plots below: